

Coffee, chocolates and alcohol…how I cherish them. But a dog probably doesn’t feel the same — all three items are poisonous to them!
And this difference is the basis for my next topic: Species Sensitivity Distribution (SSD). All species have unique sensitivities to chemicals. SSD tries to ‘map’ these sensitivities. In toxicological terms, SSD is a mathematical model that describes the variation in toxicity (or chemical sensitivity) between species.
How are SSDs generated?
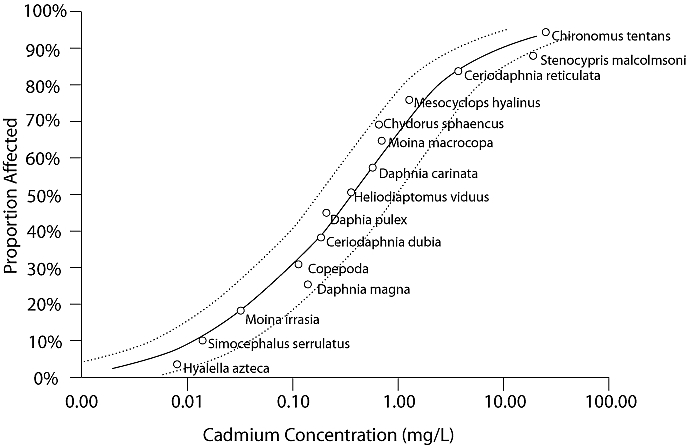
For SSD models to work well, it is important to select a set of species that are similar to one another or share similar habitats. This is because species that are alike or live together are more likely to respond similarly. Then, for each species, a selected ‘endpoint’ for a chemical (example: the concentration of a chemical that kills 50% of a species’ population — the LC50) is selected and plotted on a graph. Based on how well a line fits through the endpoints, the distribution of species can be described graphically (see image for reference).
Where are SSDs used?
SSDs can be used to set a safe limit for a chemical in the environment. The concentration that causes no harm to at least 95% of species is often selected as the maximum safe limit. For example, in the above graph, the safe limit for cadmium could be set around 0.01 mg/L. Conversely, it can also be used to estimate the proportion of affected species at a given concentration. And, as there are many species that cannot be tested due to experimental, ethical or financial restrictions, sensitivity data from other species can be extrapolated to non-testable species through SSD graphs. For example, SSDs have been used to estimate toxicity of pesticides to endangered/threatened species and have helped refine, reduce, and replace animal use in toxicity studies. They can also help identify surrogate species for toxicity testing.
Drawbacks of SSD
- SSD data come from single species toxicity tests. This means ecosystem-level effects like interactions between species and habitat cannot be captured.
- While chronic (long-term studies which look for sublethal effects) data are preferred, acute (short-term studies which look for lethal effects) data are frequently used. This is because mortality is easier to extrapolate to other species.
- SSDs are biased by available data and the quality of studies. Additionally, most studies employ different testing methods, which can result in inaccurate comparisons.
- SSDs often don’t place greater emphasis on survival of species that are critical for the ecosystem (and on which other species depend on).
Conclusions
SSD is a powerful tool for setting safety limits for chemicals and for estimating a chemical’s effect on non-testable species. It also contributes to the goals of Tox21. However, as extrapolation of data is inherently uncertain, SSD is not a foolproof method to estimate ‘safe’ concentrations of a chemical.
Source
Leo Posthuma, Glenn W. Suter II, Theo P. Traas. Species Sensitivity Distribution in Ecotoxicology. CRC Press Book (2001).

3 Comments