
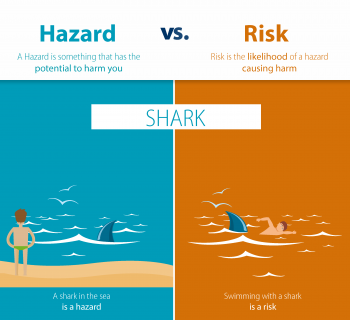
Featured image: The difference between hazard and risk. Image source: European Food Safety Authority, 2016
We all know sharks can be dangerous. But most of us don’t spend our waking hours worrying about sharks because we rarely encounter them. This might change if you had to swim or surf in the sea.
In this example, the shark is the hazard (or, w.r.t. toxicology, a toxic substance). Exposure to sharks only occur when you enter the sea. While there is little data on how many people enter the sea every year, it is conceivable that millions do. But there are less than a 100 shark attacks every year. Therefore, the risk (or likelihood) of being attacked is extremely low. But if you enter a sea infested with human-attacking sharks, your risk increases. On the other hand, for an average person (one of the nearly 8 billion people worldwide), this risk is lower.
In short, Risk = Hazard (or Toxicity) x Exposure. It is the likelihood of a hazard causing harm. There is no risk if there is no hazard or no exposure. And the magnitude of risk is determined by the hazard (say, shark vs dolphins) and exposure (entering a sea infested with sharks vs not entering).
What risk is acceptable?
Since shark attacks are so rare, we need not worry about the risk posed by them. But what about pesticides? Or alcohol? How do we find out if the risks they pose are acceptable or not?
The U.S. Environmental Protection Agency (USEPA) uses something called a Margin of Exposure to find this out. They do this especially for pesticides.
Margin of Exposure = No Observed Effects Level/Estimated Exposure Dose
- No Observed Effects Level (NOEL) = The highest concentration or dose of the pesticide that is safe.
- Estimated Exposure Dose (EED) = The overall dose or concentration of the pesticide that humans are exposed to (from food, drinking water, and residential exposures). The dose or concentration of pesticides which act similarly are also added up to obtain this value.
*Lower the Margin of Exposure (MOE), higher the risk*
Since humans cannot be given pesticides and tested in the traditional sense, animals are instead used to generate NOELs. Typically, rats and mice are given different doses of the pesticide and a NOEL is identified. EED is calculated using some of the methods described in the post How to estimate chemical exposure. In general, EPA calculates MOEs for short-term food exposure to pesticides by selecting the amount of pesticide that 99.9 percentile of the population consumes in a single day. To calculate MOEs for long-term food exposure to pesticides, EPA estimates the average amount of pesticide a person might consume over several months to a lifetime.
Usually, if the MOE is equal to or greater than 100, then the pesticide is assumed to be safe. This means that the dose of chemical you’re exposed to should be at least a 100 times lower than the (highest) dose that is safe. As children and the elderly are more susceptible, their MOEs should exceed 1000 (i.e., their exposure should be 1000 times lower than the highest dose that was found to be safe). If the MOE is lower than these values, the pesticide is assumed to pose a risk.
Such MOEs are called deterministic because a single exposure and hazard concentration has been identified for the entire human population. The reality, of course, is different. Humans are exposed to different concentrations of pesticides and show different susceptibilities. Hence, there is an increasing push to use probabilistic MOEs. This means using multiple exposure and hazard concentrations (or the whole dose-response curve) and finding the probability of risk for a population or community (the EPA currently uses multiple exposure concentrations but not multiple hazard concentrations). This could translate to something like 95% of a population are not at risk from the pesticide, while 5% are at some risk. Such information can help agencies make better decisions and identify ways to reduce risks to susceptible individuals in the population or to all individuals in a sub-population that’s at risk (for e.g., by lowering their pesticide exposure or by restricting the pesticide’s use in those places).
Perception of risk
Several studies have looked at how the public and experts rank risks of various activities and technologies. Below is a table from one such study (rank 1 is the riskiest and rank 30 is the least riskiest).

So one probably shouldn’t approach laypeople to identify risky technologies or activities. But it is important that the concerns of the public are included in the decision-making process. More on this and other regulation aspects later!
Sources:
U.S. EPA Human Health Risk Assessment
https://www.epa.gov/sites/production/files/2015-07/documents/trac2b054_0.pdf

4 Comments